CityGuard for Traffic Statistics
Our Traffic statistics version includes four models working together collecting data sent to the main database to get accurate reports of city, highways depending on your filtered requirement such as Date/time, location, lane, type of car, make and model of car. And make a comparison between two different types of filters.
Cityguard models:
Below models work together on each frame with a processing time ~0.040 ms.
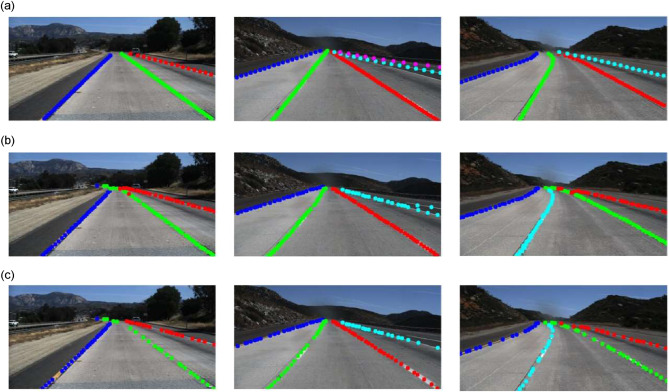
The vehicle detection model works by analyzing the visual features of video frames to identify objects that are likely to be vehicles. These features can include color, texture, shape, and motion patterns. The model then uses machine learning techniques to classify these objects as vehicles or non-vehicles based on their visual features.
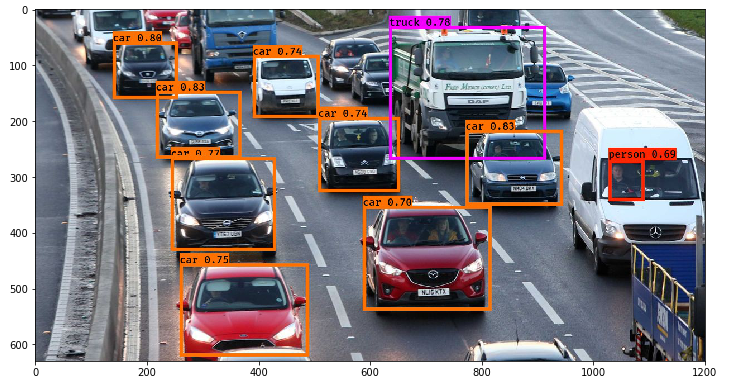
The vehicle classification model detecting specific types of vehicles (e.g. cars, trucks, motorcycles) learns to recognize visual patterns and features that are associated with each class. can be used to monitor traffic flow, identify parking violations, or detect suspicious activity.
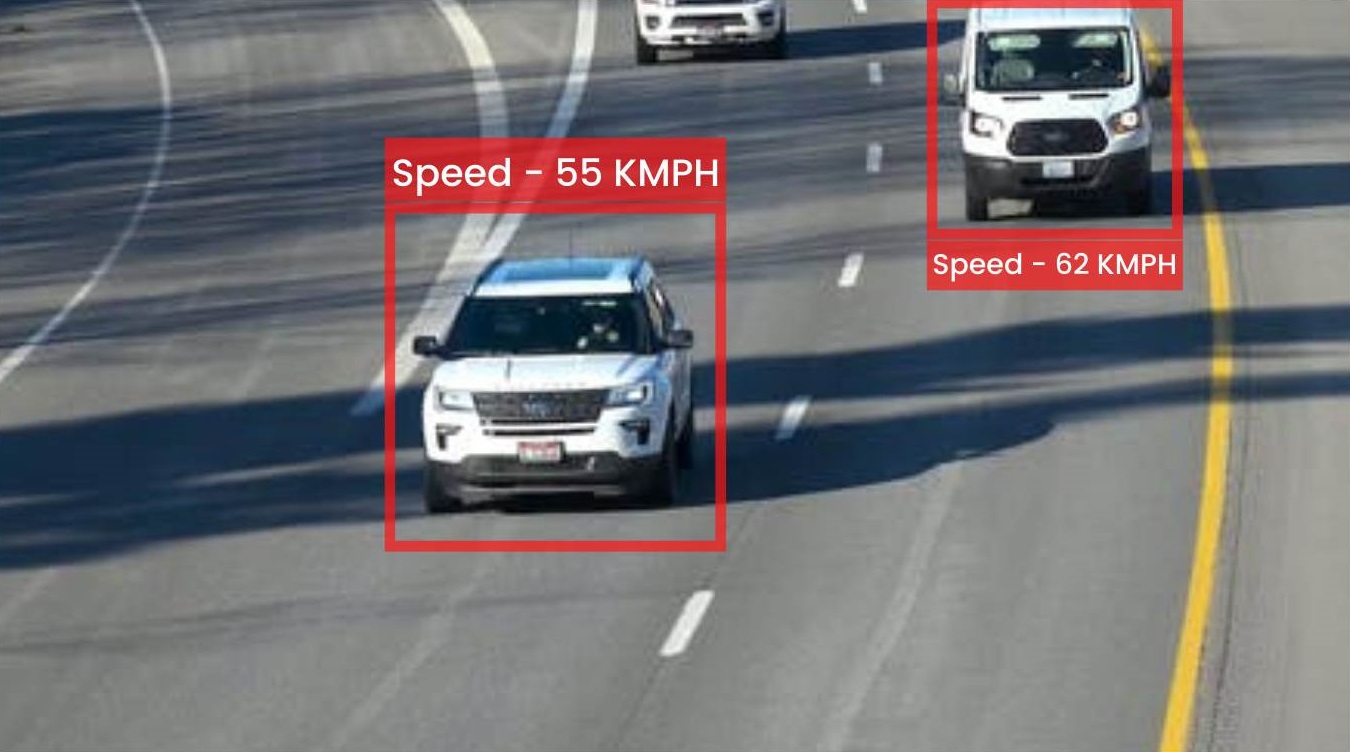
The speed detection model works by analyzing a series of videos of the moving object over a period of time. The model calculates the distance that the object has traveled between each frame, and uses this information to estimate its speed.
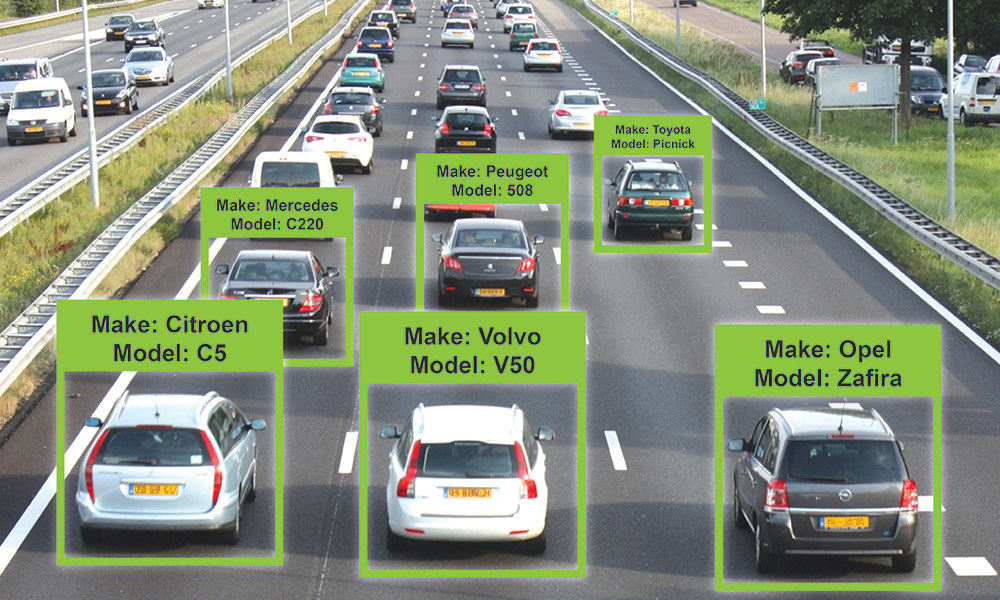
A vehicle make detection model analyzes the visual features and patterns unique to different vehicle makes and brands to automatically identify the make of a vehicle from camera. It uses visual cues such as the shape, size, and position of the headlights, taillights, grill, and other identifying characteristics to make its determination
Reports
This report provides information based on three factors: date range, location, and lane. For example, you can search for all vehicles that passed through a specific location and lane within a one-month period. This allows you to easily track and analyze traffic patterns in a given area, and can be useful for a variety of purposes such as optimizing traffic flow or identifying potential issues with the road network.
Cityguard provides a comprehensive speed report that includes a range of valuable information about traffic flow and vehicle speed in a given area. With our advanced technology, we are able to capture and analyze data on the average speed of vehicles passing through a particular location, as well as the maximum and minimum speeds recorded. In addition to this, our speed report provides detailed information about the number of vehicles that exceeded the speed limit, as well as the extent to which they were driving over the limit. By identifying patterns in driver behavior, our speed report can help to inform decisions about traffic management and safety, and can be a valuable tool for improving road safety and reducing the risk of accidents.
A lane report provides a detailed analysis of vehicle movement through a specific location, capturing data such as vehicle type, make, model, color, and number plate information. The report includes information such as the number of vehicles passing through a particular lane, the average speed of vehicles, the direction of traffic flow, and the duration of each vehicle’s stay. Additionally, it offers a breakdown of the types of vehicles passing through the lane, including cars, trucks, buses, and motorcycles. It is a valuable tool for authorities and businesses looking to manage traffic, monitor vehicle movements, and ensure public safety.
Classification report provides detailed information about the make and model of vehicles passing through a specific location, based on the data captured by the system. The report includes information such as the number of vehicles passing through a particular location, the number of vehicles classified by make and model, and the percentage breakdown of vehicles by make and model. Additionally, it provides specific details about each vehicle, including make, model, and color information, which can be used to identify trends in the types of vehicles passing through a particular location. The classification report is a valuable tool for authorities and businesses looking to track the types of vehicles passing through a location, and can be used to improve traffic management, monitor vehicle movements, and ensure public safety.
Direction report provides detailed information about the direction of vehicles passing through a specific location, based on the data captured by the ANPR/LPR system. The report includes information such as the number of vehicles passing through the location, the number of vehicles moving in each direction, and the percentage breakdown of vehicles by direction. Additionally, it can provide specific details about each vehicle, including the date and time of passage, license plate number, and other relevant data. The direction report is a valuable tool for traffic analysis and management, allowing authorities and businesses to identify traffic patterns and trends, optimize traffic flow, and make data-driven decisions about traffic management and public safety.
Our systems offer users the option to switch between detailed and summary modes of reporting. The detailed mode provides more in-depth information on each captured plate number, while the summary mode gives users a quick overview of captured data.
In detailed mode, the report typically provides a wide range of information on each captured plate number, including the date and time of capture, the exact location of the capture, the lane number, vehicle type, make and model, color, image of the vehicle, and more. With detailed reporting, users can gain a more comprehensive understanding of the captured data, and this can be helpful in identifying trends or specific vehicles of interest.
In contrast, summary mode provides users with more compact and simplified information, such as the total number of vehicles captured within a certain time frame, the number of unique vehicles, and possibly the number of vehicles by type or make. This mode is more suitable for users who need a quick overview of the captured data without the need for detailed information.
Overall, the choice of reporting mode depends on the user’s needs and the purpose of the captured data. Some users may prefer detailed reporting for more in-depth analysis, while others may find summary reporting more appropriate for their needs.
Tables
For a detailed report the user will get a table as such filled with information about every place. Additionally, there will be many filters that will help the user to get a report for a specific time, location, make, etc. Moreover, this table could be extended to further help the client with what they need by simply asking what they want to be included as well.
But if the user doesn’t need all the information above they could simply pick the summary version of the report and they will be presented with a summary instead of the report above. For example:-
Simple
|
Total Vehicles |
110 |
|
Total Cars |
66 |
|
Total Trucks |
30 |
|
Total Motorcycles |
14 |
|
Average Speed of All Vehicles |
89 |
|
From Date |
02/21/2023 |
|
To Date |
02/22/2023 |
|
Location |
Shorash Street |
|
Camera |
Shorash Cam3 |
|
Total of all Speeding Vehicles |
12 |
|
Average of all Speeding Vehicles Speed |
103 |
|
Maximum Speeding Vehicle Speed |
124 |
|
Total of all Slow Vehicles |
4 |
|
Average of all Slow Vehicles Speed |
48 |
|
Minimum Slow Vehicle Speed |
43 |
|
Total Vehicles per Lane |
110 |
Extended
|
Total Vehicles |
110 |
|
From Date |
02/21/2023 |
|
To Date |
02/22/2023 |
|
lane |
2 |
|
Total Cars |
66 |
|
Total Trucks |
30 |
|
Total Motorcycles |
14 |
|
Average Speed of All Vehicles |
89 |
|
Average Speed of All Vehicles within speed limit |
72 |
|
Camera |
Shorash Cam3 |
|
Total of all Speeding Vehicles |
12 |
|
Total of all Speeding Cars |
7 |
|
Total of all Speeding Trucks |
3 |
|
Total of all Speeding Motorcycles |
2 |
|
Average of all Speeding Vehicles Speed |
103 |
|
Average of all Speeding Cars Speed |
110 |
|
Average of all Speeding Trucks Speed |
95 |
|
Average of all Speeding Motorcycles Speed |
98 |
|
Maximum Speeding Vehicle Speed |
124 |
|
Total of all Slow Vehicles |
4 |
|
Total of all Slow Cars |
1 |
|
Total of all Slow Trucks |
2 |
|
Total of all Slow Motorcycles |
1 |
|
Average of all Slow Vehicles Speed |
48 |
|
Average of all Slow Cars Speed |
55 |
|
Average of all Slow Trucks Speed |
44 |
|
Average of all Slow Motorcycles Speed |
47 |
|
Minimum Slow Vehicle Speed |
43 |
|
Total Vehicles per Lane |
110 |
|
Total “Make” Vehicles |
33 |
Also usually when searching the user has many options to use that could be beneficial for the user in other ways. One more type of result that a user can get is a table full of all the vehicle’s information.
|
ID |
Date & Time |
Location |
Lane |
Vehicle Type |
Make |
Model |
Color |
Country |
Direction |
image |
|
3 |
13:52 02/21/23 |
Shorash |
1 |
car |
Toyota |
corolla |
white |
Iraq |
exit |
link |
